Final Project
Cluster REDBAD
Use Docker container rubigdata/redbad to issue commands on
our brand new educational cluster REDBAD.
REDBAD
The cluster consists of 2 main nodes (redbad01 and redbad02) and
11 workers (rbdata01 - rbdata11). You need to connect to the
VPN provided by the Science Faculty
to access those machines (or, alternatively, run the container on a
computer in the Huygens building; additional instructions specifically
for Huygens are provided at the bottom of this
page).
Setting up VPN is preferable though, because then you can access all
the Web UIs without setting up ssh tunnels for every different UI).
House Rules
The cluster has not been secured, so you are expected to behave properly.
Do not impersonate a different student!
We have used the github usernames of students who accepted the final project to create user directories on the cluster.
Yarn has been setup with three different queues. For initial trial
runs, use the smaller default queue. When these run fine, you think
the code is ready for larger scale data processing and you’d only need
additional resources to succeed, you can submit jobs to the silver
queue.
Please use gold only for code that has been tested thorougly, and is
intended as a (semi-)final run that requires quite a few resources.
Getting Started
Set the environment variable GITHUB_USERNAME to the github
accountname you used throughout the course, i.e., replace the XXXXX
here:
export GITHUB_USERNAME="XXXXX"
Create and start a container to work on the cluster:
docker create --name redbad -e HADOOP_USER_NAME=${GITHUB_USERNAME} -it rubigdata/redbad
docker start redbad
Attach to the container for shell access to the cluster:
docker attach redbad
Using HDFS
When you issue HDFS commands in the rubigdata/redbad container, they
are directed to the cluster. Take a look at the directories that
already exist on the cluster:
hdfs dfs -ls /
HDFS has been configured in High Availability mode, where one
of redbad01 and redbad02 is active, and the other one
standby. Depending on the namenode that is the active one (which
would switch upon failure), you would access the namenode’s WebUI at
redbad01.cs.ru.nl:9870 or
redbad02.cs.ru.nl:9870 (these links
require Science VPN, setup an ssh tunnel to localhost otherwise).
Curious which namenode has which role? It’s listed in the Namenode’s Web UI, but you can also find it using the HDFS CLI:
hdfs haadmin -getAllServiceState
(Apart from running Hadoop in high availability mode, the cluster is
also prepared for a so-called federated setup, with an educational
part identified by gelre and a research part identified by
frisia. However, only the educational cluster is operational at this
point of time, so you may forget this immediately.)
Distributed Filesystem Configuration
File and directory names can be given with or without prefixing an
explicit cluster-identifier (gelre for the
educational cluster) or namenode (redbad01 or redbad02, depending
upon which is active and which is standby); in other words, /,
hdfs:///, hdfs://gelre/ and hdfs://redbad01:8020/ or
hdfs://redbad02:8020/ all refer to the same root directory of the
HDFS filesystem on REDBAD.
Let’s continue our discussion of the listing of the root directory
at the cluster. /app-logs and /tmp are system directories that
end users can safely ignore. The home directories are important
though; these reside under /user, issuing hdfs dfs -ls or
hdfs dfs -ls . lists the contents of your (empty) homedir,
/user/XXXXX.
Upload the test data for the example standalone Spark program to your home directory:
hdfs dfs -put rubigdata-test.txt /user/${HADOOP_USER_NAME}
Check that it has been added correctly:
hdfs dfs -ls /user/${HADOOP_USER_NAME}
Crawl segment
Directory /cc-single-warc-segment/ is the main target in Part
III. It contains a “small” part of one of the monthly crawls. When we
ran our first commands to test the cluster setup, we copied this
segment onto the cluster using the hadoop distcp command.
A single crawl segment is more than enough data to test your program created in part I & II on its scalability:
[hadoop@77316fead95b rubigdata]$ hdfs dfs -du -h -s hdfs:///single-warc-segment
727.4 G  1.1 T  hdfs:///single-warc-segment
The first number is the size of the data in HDFS, i.e., what you notice as a user when you read the data. The second number is the size on raw disk, including its replicas. (The second number is lower than 3x the first number, because we stored this data using the new Hadoop 3 feature of erasure coding, a different way to provide fault tolerance that trades off disk space consumption for CPU and network costs while reading the data.)
CC-INDEX
Directory /cc-index-subset contains the CC-INDEX files in Parquet
format, that you can query to identify interesting subsets. You will
find more information about the CC-INDEX in the Commoncrawl
documentation, and we provide a few examples using the
CC-INDEX to get you started using this
resource (feel free to skip).
CC-MAIN-2021-17
As soon as the cluster could execute map-reduce jobs (about a week
ago), we have been running distributed copy jobs to transfer a copy of
the CC-MAIN-2021-17 (april 2021) crawl to REDBAD. At the time of
writing, the map-reduce task to copy the crawl has reached about 80%
of completion; you can check if it is still running using
yarn app -list or yarn top.
Copying the data is time-consuming, but so is processing all that data, especially since our cluster has not that many nodes. Let’s focus on a single segment for now, unless you have very good reasons to plough through even more than 0.8 TB of crawl data.
If you think you really do all that Crawl data, contact us (in the Matrix room) first.
Using Spark
Now that we revisited usage of HDFS (introduced in assignment two), let’s move on to running Spark programs on the cluster. Take a simple program that you know is correct, for example, compile and package the letter-counting Spark program that we started with in Part II.
Before you proceed: edit the example program to read test file
rubigdata-test.txt from the correct location in HDFS, i.e.,
hdfs:///user/XXXXX/rubigdata-test.txt.
Then create the Fat Jar for submitting the code to Spark:
sbt assembly
(You will probably recall from part II that the first run of sbt
takes much longer than subsequent runs… I found that this step
benefits a lot from temporarily turning off VPN. Upon [success],
do not forget to turn VPN back on, or your machine cannot find the
REDBAD nodes.)
Finally, you are ready to submit code as a Spark job to the cluster!
Spark jobs are submitted using Yarn in deploy mode
cluster. (Our tiny container is not really suited to act as a true
node in the cluster, so we should not use Yarn client mode.)
Apart from deploy mode, also specify the desired queue (one of
default, silver or gold, refer to the House
Rules before deviating from default); and, issue
spark-submit:
spark-submit --deploy-mode cluster --queue default target/scala-2.12/RUBigDataApp-assembly-1.0.jar
If things work out fine, you will now see quite a few messages appear, first some basic log info. After these initial (ten plus) debug lines, Yarn will indicate that it uploads your Fat Jar to the cluster to be deployed as a Spark job.
As the following step, Yarn will indicate that it proceeds to submit
the application and notifies you of the application identifier; you
need that identifier for inspecting status and output. The
application will start with state: ACCEPTED until Yarn can allocate
the required resources to run the job, when its status will move to
state: RUNNING.
The cluster has been setup with a so-called job history server that aggregates the logs of an application (i.e., it collects the logs from the different worker nodes and puts a merged copy on HDFS). We also configured the Spark history server, that provides user friendly access via a Web UI for running (incomplete) and finished (completed) applications.
You can inspect logs of applications using the Yarn CLI (use a
docker exec -it redbad /bin/bash command in a different terminal
while your other container is still busy reporting debug information),
e.g., assuming application identifier application_1623272363921_0008
you would request:
yarn logs \
  -applicationId application_1623272363921_0008 \
  -log_files stdout
More conventiently than using these CLI commands, you can also find
your application in the Spark History Server that runs on
rbdata01. Its Web UI is found at
rbdata01.cs.ru.nl:18080.
Click on your application’s identifier to view Spark’s job
information.
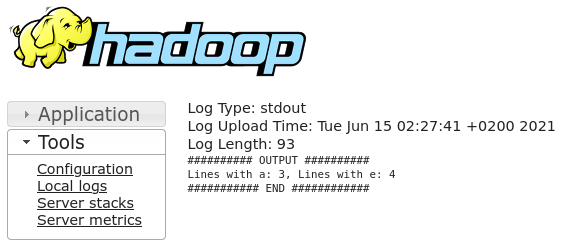
Under the Executors tab, find the line corresponding to the driver
node to locate the output of our println commands (these print on the
stdout of the driver node), and you see something similar to this
screenshot from my browser window:
If all of this worked fine, you should copy the code for your project
from parts I and II into the new redbad container, and try to
process crawl data read from HDFS!
Using the Huygens machines
If you cannot get VPN to work from home, a solution is to start the docker container on machines in the Huygens building.
Things may actually also work correctly by using your own machine connected to internet via eduroam; I have not yet had the chance to test this.
Docker is available for our use on the machines in HG 03.761 hg761pcXX (replace XX by the machine
number). You can ssh into machines in those rooms, as long as they
were booted in Linux. Hereto, you have start an ssh client from the
Linux Login server, lilo.science.ru.nl. Login on lilo via ssh;
or, if you’re on Windows but did not install WSL(2), you’re probably
better off using Putty instead.
Students in the course should be able to run Docker when logged in
onto one of these machines, assuming you were formally enrolled
when CNCZ updated the group earlier this semester; if docker ps
gives errors and the output of groups does not include docker, let
me know and I will add you (I need your science accountname to do
so).
If you need help, do not hesitate to find us in the Matrix room for assistance.